Analytics
See what worked.
And what to do next.
Most dashboards show every number to everyone. Build the view each person needs, send it under your own name, and let Kanso point to what the results suggest.
Reach
18.4k
+12% vs August
Link clicks
126
+18 vs August
Best posts
 Your kitchen is off duty.7.9K
 Whose turn is it to cook?6.1K
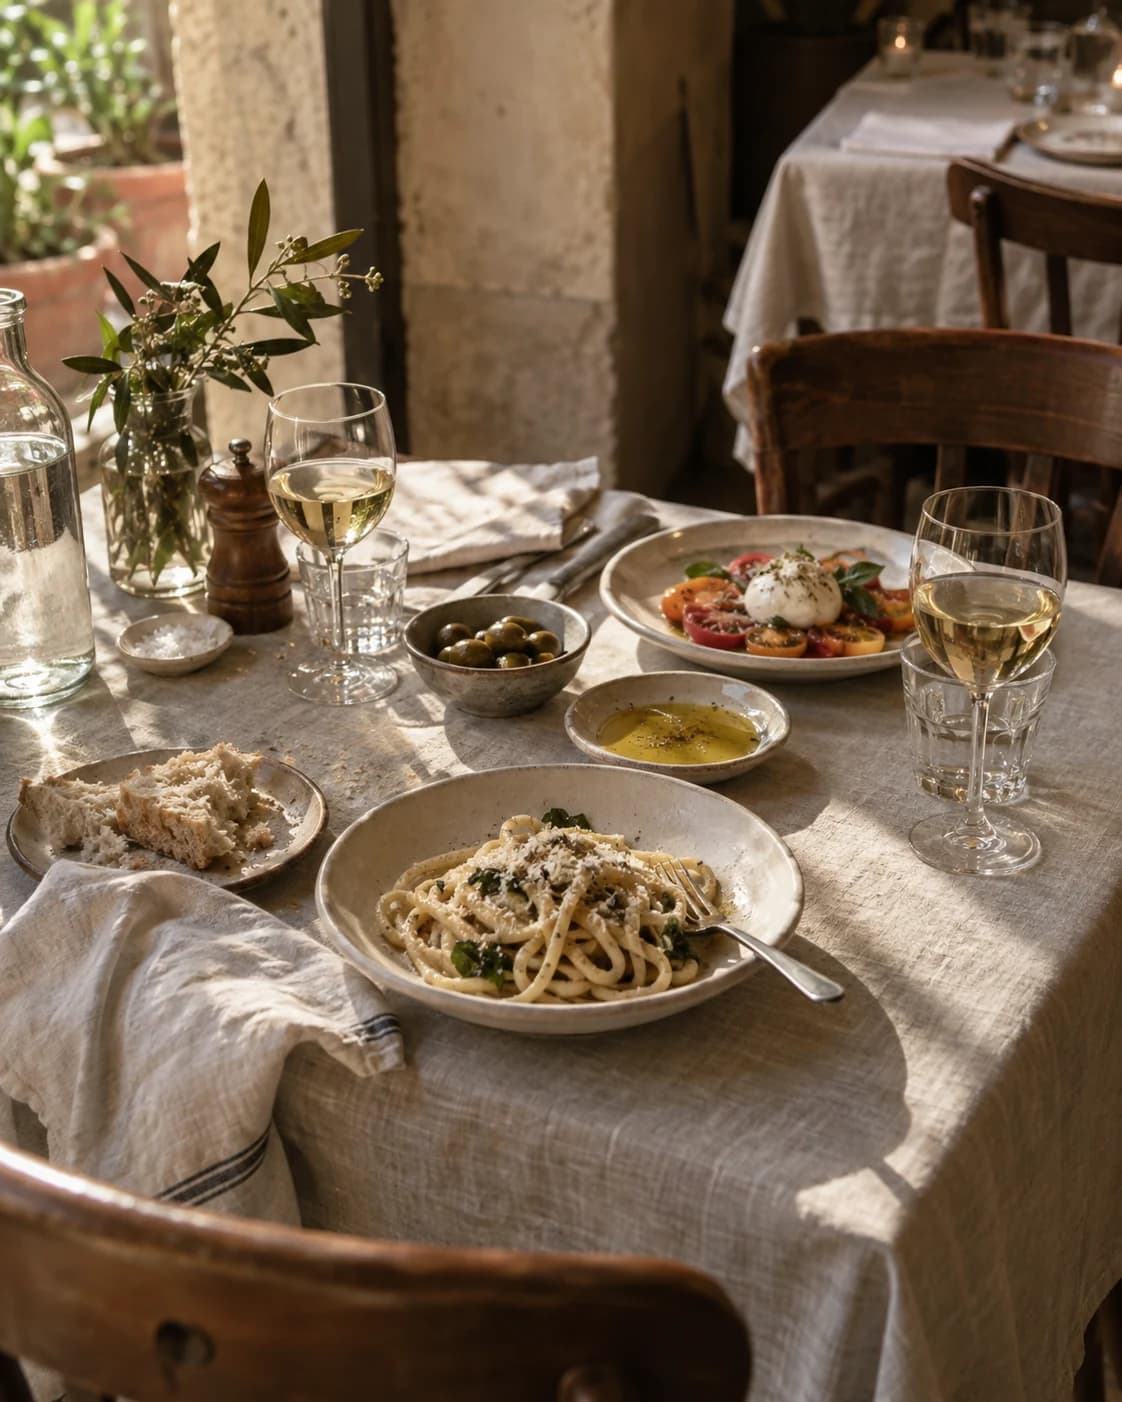 We’re setting the table.4.4K
By reach
One account.
A view for each reader.
Pick who the view is for, then switch tiles on and off. The owner doesn’t need what the person writing the posts needs.
Reach
18.4k
+12% vs August
Link clicks
126
+18 vs August
Best posts
- Your kitchen is off duty.7.9K
- Whose turn is it to cook?6.1K
- We’re setting the table.4.4K
By reach
Try it: a sample view you can rebuild. Nothing is saved. Sample data for an invented business.
01Your own views
The same results.
Different questions.
A view is a saved choice of tiles, period and channels. Make one per reader and open it again next month with fresh numbers.
The owner asks
Is it bringing people in?
Reach, link clicks and the three posts that did best. Nothing to decode.
- Reach
- Link clicks
- Best posts
The campaign asks
Did the idea land?
Results by content pillar and by post, for the weeks the campaign ran.
- Reach
- Engagement rate
- By content pillar
- Best posts
The team asks
What should we repeat?
Saves, channels and days, down to the single post.
- Engagement rate
- Saves
- By channel
- Best day
- Best posts
02Under your name
Their report.
Your name on it.
Send a view as a link or a PDF with your logo, your colours and your own address. The client sees a report from you, with no Kanso branding and no account to create.
A link stays current as new results come in. A PDF is a fixed record of the month, for the people who file things.
September report
Summary
More people saw the posts than in August, and more of them tapped through to the website. The Sunday posts did the most of that work.
Reach
18.4k
+12% vs August
Link clicks
126
+18 vs August
Updates with new resultsNo Kanso branding
03What the numbers suggest
A suggestion.
With its evidence.
Kanso reads the results next to the brief and proposes what to try. Each suggestion names the posts it comes from and says when the sample is small.
It doesn’t decide for you. Keep a suggestion and it joins the next plan; dismiss it and it’s gone.
Read: analytics that change the next postBased on 2 postsSmall sample
What happened
Two posts opened with a question. They were saved about twice as often as the other four.
What to try
Open two of next week’s posts with a question your customers actually ask.
Based on 4 posts
What happened
Posts published on Thursday evening reached more people than the morning ones.
What to try
Move one planned post from Tuesday morning to Thursday evening and compare.
Based on 1 postSmall sample
What happened
The carousel brought more link clicks than any single-photo post.
What to try
Turn the next offer post into a carousel, with the link on the last slide.
- Sample data for an invented business.
Results go back
into the next brief.
What you learn from one month is where the next one starts.
- M
- T
- W
- T
- F
- Saved 2× more
Analytics
What it did.
The results of what went out, and what they suggest.
You’re here
Audience
The family organizer
Owner’s note
A few useful
answers.
Know what to
post again.
Join the waitlist and we’ll get in touch when beta access is available.